Why we ask you to reflect in Graduate Outcomes
HESA's Data and Innovation team explain the reasons behind some of the questions in the Graduate Outcomes survey.
HESA has just released a new suite of outputs relating to the Graduate Outcomes survey and we would like to express our thanks to all those who participated over the past year.
Whether you have received your invitation to take part or not, you may be wondering not only what the survey is about, but also why we ask certain questions and how we use that information.
Consequently, while we have previously highlighted why it is important to complete the survey, we want to take this opportunity to explain the reasons behind some of the questions that are included in two separate sections of the survey, which may not appear obvious at first glance.
Your employment: A matter of detail
As the survey is about outcomes, we ask for quite detailed information on your current employment, such as your job role, main duties and the employer you work for. Given the huge variety of jobs that graduates will find themselves in after completing their studies, it is essential for analysts and policymakers exploring the impact of higher education to consolidate this data in a useful way.
Using the details you provide on your employment, we allocate you a Standard Occupational Classification (SOC) code, which indicates the type of occupation you are working in. We also use your employment information to identify the sector of the economy in which you are contributing your skills by assigning you with a Standard Industrial Classification (SIC) code. These SIC and SOC codes may then be aggregated further, depending on the type of analysis being conducted. For example, SOC codes may be used to group workers into one of nine categories, based on the level of skills and qualifications needed to perform the role.
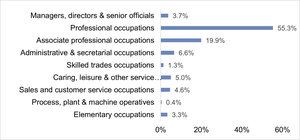
This horizontal bar chart displays the percentage distribution of graduates across different occupational categories. The x-axis ranges from 0% to 60%, and each bar represents a specific occupation type, showing how common each is among graduates.
The largest proportion of graduates - 55.3% -are in professional occupations, making this the most common category by far. The next largest group is associate professional occupations at 19.9%, followed by administrative and secretarial occupations at 6.6%.
Other categories include:
Managers, directors & senior officials: 3.7%
Caring, leisure & other service occupations: 5.0%
Sales and customer service occupations: 4.6%
Elementary occupations: 3.3%
Skilled trades occupations: 1.3%
Process, plant & machine operatives: 0.4%
The chart highlights that most graduates enter professional or associate professional roles, with relatively few in manual or elementary occupations.
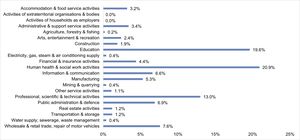
This horizontal bar chart presents the percentage distribution of graduate employment across various industry sectors. The x-axis ranges from 0% to 25%, and each bar represents a different sector, with its length indicating the proportion of graduates working in that area.
The sectors and their corresponding percentages are:
Human health & social work activities: 20.9% – the largest share of graduate employment.
Education: 19.6% – the second largest sector.
Professional, scientific & technical activities: 13.0%
Information & communication: 6.6%
Manufacturing: 5.3%
Financial & insurance activities: 4.4%
Administrative & support service activities: 3.4%
Accommodation & food service activities: 3.2%
Arts, entertainment & recreation: 2.4%
Construction: 1.9%
Other service activities: 1.1%
Electricity, gas, steam & air conditioning supply: 0.4%
Mining & quarrying: 0.4%
Agriculture, forestry & fishing: 0.2%
Activities of households as employers and Activities of extraterritorial organisations & bodies: both at 0.0%
The chart highlights that most graduates are employed in health, education, and professional services, while very few work in sectors like agriculture, mining, or household employment.
Having this information allows:
- Government and policymakers to identify the parts of the economy where graduates are contributing their skills and knowledge – both now and over time.
- Prospective and current students to understand which sectors and occupations are most likely to employ graduates.
- Careers advisers and employers to examine the current and evolving nature of the graduate labour market.
Reflecting on your activity - giving graduates a voice
We recognise that the outcomes of higher education for graduates are not only financial or necessarily solely about employment. Many of you will have undertaken study to pursue your career ambitions or due to interest in a subject. This fact is also appreciated by policymakers across the UK, who want graduates to have the opportunity to achieve personal fulfilment in their lives, as well as to be equipped with skills that can boost productivity and economic growth. It is for this reason that we encourage survey participants to reflect on their activity and highlight the extent to which they agree with the below statements:
- My current activity is meaningful
- My current activity fits with my future plans
- I am utilising what I learnt during my studies in my current activity
Achieving fulfilment is likely to require undertaking activities that provide a sense of purpose. Consequently, we not only ask you about whether your present activity aligns with your longer-term ambitions, but to also make a subjective judgement about the extent to which this activity is of personal significance and meaning to you.
How might this data be used and why?
Your answers to these questions can be used in a variety of ways, including in combination with your responses to the employment section of the survey. For example, it could be drawn upon by:
- Organisations like HESA in examining the types of occupations that graduates find fulfilling and meet their career aims. We can then communicate these findings to prospective students and graduates, who may be looking to make choices about their future study plans or employment pathway.
- Graduate employers who want to evaluate how graduates feel about the types of jobs being offered within their sector.
- Policymakers who want to assess the impact that public funding of higher education has on both students and wider society.
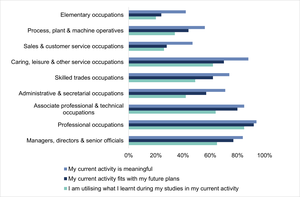
This horizontal bar chart compares how graduates in different occupational categories perceive their current work in terms of meaning, alignment with future plans, and relevance to their studies. The chart includes three color-coded bars for each occupation:
Light blue: “My current activity is meaningful”
Dark blue: “My current activity fits with my future plans”
Green: “I am utilising what I learnt during my studies in my current activity”
The x-axis ranges from 0% to 100%, showing the percentage of respondents who agreed with each statement.
Occupational categories listed from top to bottom are:
Elementary occupations
Process, plant & machine operatives
Sales & customer service occupations
Caring, leisure & other service occupations
Skilled trades occupations
Administrative & secretarial occupations
Associate professional & technical occupations
Professional occupations
Managers, directors & senior officials
Key insights:
Managers, directors & senior officials report the highest levels of meaning (around 80%), future alignment (about 70%), and educational relevance (around 60%).
Professional and associate professional roles also score highly across all three measures.
Elementary occupations show the lowest levels of agreement across all criteria, indicating less perceived meaning, future alignment, and educational relevance.
The chart highlights how perceptions of job satisfaction and relevance vary significantly across occupational types.
Our mission at HESA is to collect and subsequently release data in a manner that can advance understanding within society about higher education. We do so to help present and future students and graduates make informed choices, but also assist our other users (such as government, education providers and employers) with their planning and decision making.
Our ability to do this rests on graduates like yourselves not only participating in the survey, but also providing accurate information to the various questions we ask within it. It is this that enables us and others to produce the types of analysis displayed in the charts and improve our knowledge about the impact of study.
Want to know more?
We hope this blog has provided an insight into the motivation behind some of the questions we pose. A more detailed version of this blog (with interactive charts and relevant links) can be found on the HESA website, where you can also find more statistics relating to the Graduate Outcomes survey.