What have we learned from the Graduate Outcomes survey so far?
Neha Agarwal reflects on key insights from your Graduate Outcomes responses. By sharing your journey, you’ve helped shape a richer understanding of success beyond university - informing policy, improving support, and highlighting the real impact of higher education on graduates’ lives.
Let's take a look at the data...
I would argue that Graduate Outcomes is more than just a standard survey. For starters, it is the largest annual social survey in the UK. It is run by a charitable organisation on behalf of the government and in collaboration with over 400 universities and colleges in the UK. It aims to contact over 750,000 people each year, worldwide. By shining a light on people’s journey beyond higher education, it offers a unique perspective on the relationship between academic, economic and interpersonal measures of success.
Using data we have collected over the last two years since we started surveying (and I’d like to thank you if you have contributed to this collection), I would like to share with you some of the emerging findings from the survey to demonstrate the significance of this research.
Who has responded to the survey so far?
We set out to contact most people who complete a higher education qualification each year. While we are not able to contact everyone, we think we’ve done a good job by obtaining responses from just under 800,000 graduates in the last two years. They come from all walks of life and represent all parts of our society.
Here’s a little snapshot of how diverse the survey participants have been:
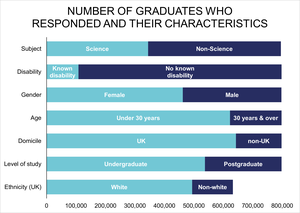
Number of graduates who responded to the survey and their characteristics - long description
This bar graph titled "Number of Graduates Who Responded and Their Characteristics" displays the number of survey respondents grouped by various demographic and educational characteristics. The x-axis shows the number of graduates, ranging from 0 to 800,000. The y-axis lists eight characteristics, each split into two categories:
Subject studied: Science vs. Non-Science
Disability status: Known disability vs. No known disability
Gender: Female vs. Male
Age: Under 30 vs. 30 and over
Domicile: UK vs. Non-UK
Level of study: Undergraduate vs. Postgraduate
Ethnicity: White vs. Non-white
Each pair of bars represents the number of graduates in each category. The graph shows that most respondents were under 30, studied non-science subjects, were female, had no known disability, were domiciled in the UK, studied at undergraduate level, and identified as white.
What are the outcomes for the class of 2018/19 graduates, 15 months later?
Successful outcomes are often measured in terms of employment and salary. However, one should also recognise that success could mean different things to different individuals and there is no single measure of success that every individual might relate to.
Graduate Outcomes draws people’s attention towards a wide range of outcomes: traditional vs non-traditional and objective vs subjective. Presenting the data in this way enables policymakers, higher education providers and governments to take a more holistic view when making key decisions and launching new policies and initiatives.
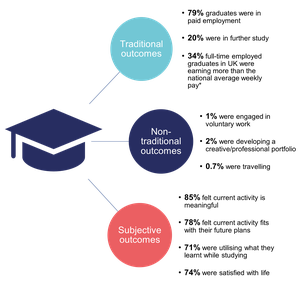
Overview of outcomes for the class of 2018/19 - long description
This infographic uses a graduation cap icon and three colored circles to present statistics on graduate outcomes. The circles represent three categories: Traditional outcomes, Non-traditional outcomes, and Subjective outcomes.
The blue circle shows Traditional outcomes:
79% of graduates were in paid employment.
20% were in further study.
34% of full-time employed graduates in the UK were earning above the national average weekly pay.
The dark blue circle shows Non-traditional outcomes:
1% were doing voluntary work.
2% were developing a creative or professional portfolio.
0.7% were travelling.
The red circle shows Subjective outcomes, reflecting graduates' personal perceptions:
85% felt their current activity was meaningful.
78% felt it fit with their future plans.
71% felt they were using what they learned while studying.
74% were satisfied with life.
The graphic highlights that while most graduates follow traditional paths like employment or further study, a smaller proportion pursue alternative routes. Importantly, many graduates report positive personal outcomes regardless of their employment status.
Impact of the pandemic on graduates and labour market – a case study
In my last blog I explained why it was so important for us to keep collecting this data and for graduates to take part in the survey, even as we were all dealing with the start of an unprecedented global crisis.
Comparison of the data collected in 2020 with the previous year has offered useful and sometimes unique insights into the impact of the pandemic on graduates and their experience of the labour market. The pandemic is still with us, and its impact will be felt for years to come. So, this is just the first iteration in a series of data-led investigations we will be undertaking as more people take part in the survey and we learn more about their experiences.
Here is a brief overview of some notable changes to graduates’ experiences during the first year of the pandemic:
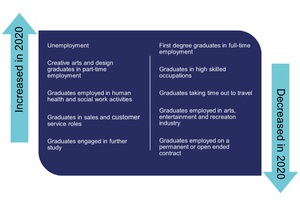
Chart shows a brief overview of some notable changes to graduates’ experiences during the first year of the pandemic - long description
This comparison chart illustrates changes in employment outcomes for graduates in 2020. It is divided into two sections: categories that saw an increase and those that saw a decrease.
On the left side, the chart highlights areas where graduate activity increased in 2020:
A rise in unemployment among graduates.
More creative arts and design graduates working in part-time roles.
An increase in graduates employed in human health and social work activities.
Growth in graduates working in sales and customer service roles.
More graduates engaged in further study.
On the right side, the chart shows areas that experienced a decline:
Fewer first degree graduates in full-time employment.
A drop in graduates working in high-skilled occupations.
A decrease in graduates taking time out to travel.
Fewer graduates employed in the arts, entertainment, and recreation industry.
A reduction in graduates with permanent or open-ended contracts.
The chart reflects the impact of the COVID-19 pandemic on graduate employment, showing a shift toward part-time work, study, and roles in health and customer service, alongside a decline in stable, high-skilled, and creative industry jobs.
The importance and impact of Graduate Outcomes
For higher education providers, researchers and policy makers, Graduate Outcomes is an important piece of the puzzle on life after education.
The survey is only in its third year. It has a long way to go before all its benefits can be fully realised. Its long-term value will be revealed once responses from a much larger number of graduates have been collected over a number of years.
I hope I have convinced you to take part in Graduate Outcomes when it is your turn to do so. If you are reading this as someone who knows a student or a recent graduate then spread the word and do your bit in creating a society that is built on the foundations of knowledge gathered from real people about their lived experiences.
You can also discover plenty of other interesting facts about graduates and their outcomes based on survey results from last two years, including a detailed insight into the impact of the pandemic.
* Based on estimates of average weekly pay in Great Britain, published by the Office for National Statistics